Atria's Brands
Atria in 2023
Atria’s net sales and adjusted EBIT increased in 2023. In a strongly changed
operating environment, Atria was successful in its business operations.
TOWARDS A
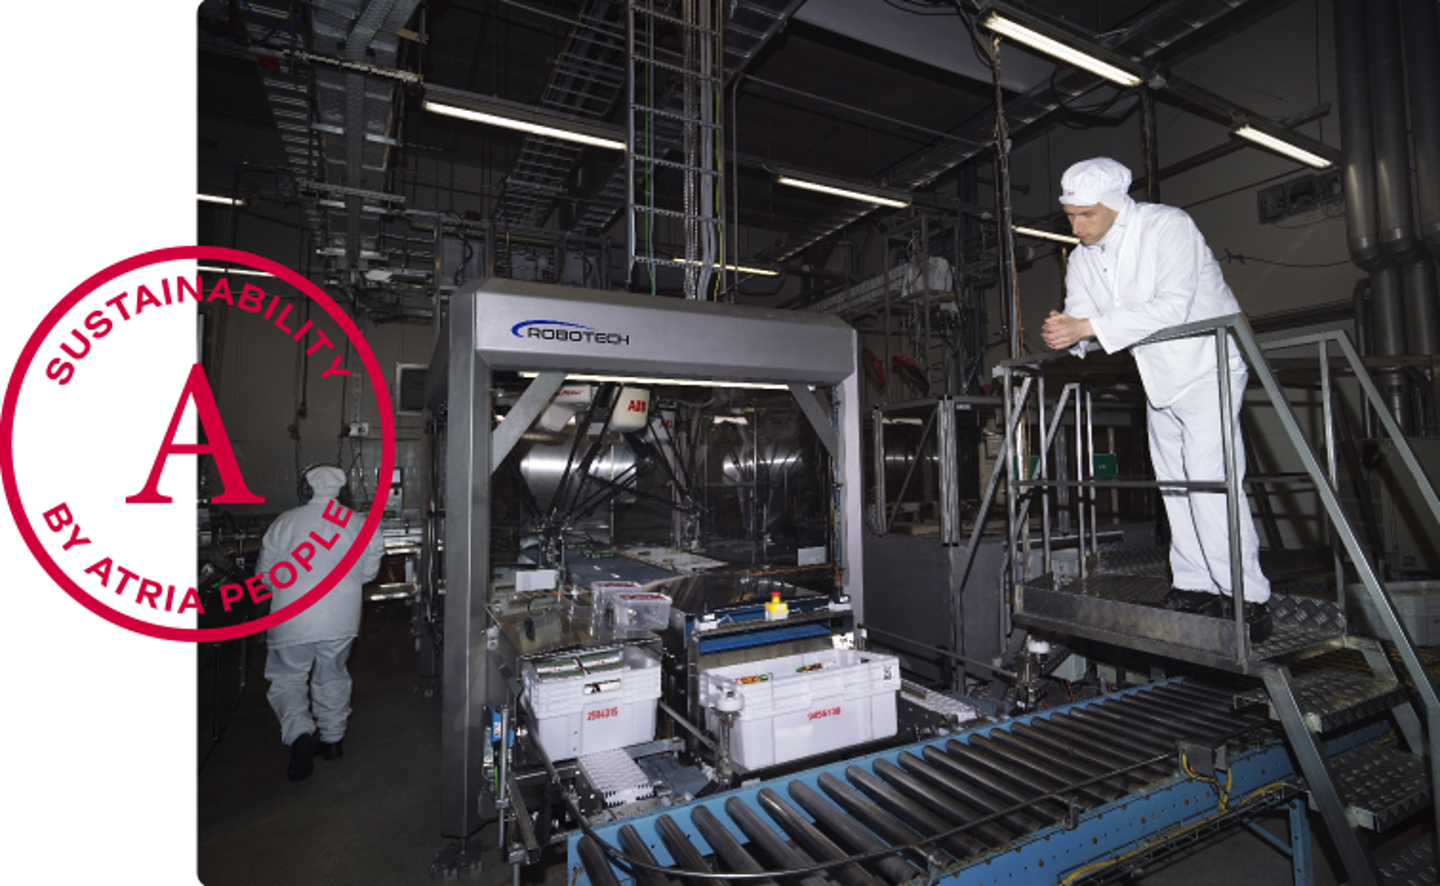
CARBON-NEUTRAL FOOD CHAIN
Atria has been producing food for over a hundred years. We want to continue to do so, which is why we operate with respect for the planet, for people and for the food they eat. We want to continue to contribute to people’s well-being and to healthy and sustainable food production.
Careers at Atria Group
We are a modern, growing international company employing on average 3,700 food industry professionals in Finland, Sweden, Denmark and Estonia.
Atria Recruitment Training for international job seekers
We are recruiting production workers to our food factory in Seinäjoki Nurmo via Atria's own Recruitment Training. Training starts in January.
Meet Our People
Atria International Trainee Program is an amazing possibility for young professionals to join the world of sustainable food and business.

Northern European Food Company
Atria is one of the leading food companies in Northern Europe. In 2023, Atria celebrates its food journey that began 120 years ago in Finnish family farms and whose recipe will last for generations to come: Good food - better mood.